Short Answer
TABLE 2-17
The following table presents total retail sales in millions of dollars for the leading apparel companies during April 2009 and April 2010.
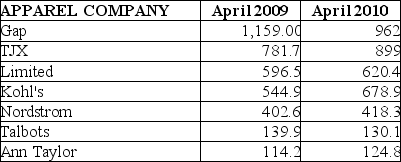
-Referring to Table 2-17, among the 8 stores, ________ saw a sales decline.
Correct Answer:

Verified
Correct Answer:
Verified
Related Questions
Q129: The width of each class grouping or
Q158: Histograms are used for numerical data while
Q171: TABLE 2-12<br>The table below contains the opinions
Q173: TABLE 2-14<br>The table below contains the number
Q174: A Wal-Mart store in a small town
Q175: TABLE 2-8<br>The Stem-and-Leaf display represents the number
Q178: Given below is the scatter plot of
Q179: Given below is the scatter plot of
Q180: TABLE 2-6<br>A sample of 200 students at
Q181: TABLE 2-5<br>The following are the duration in