Multiple Choice
A foreman wants to use an  chart to control the average length of the bolts manufactured.He has recently collected the six samples given below.
 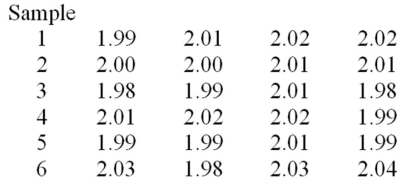 Calculate the mean of the means
A) 2.010
B) 2.406
C) 2.000
D) 2.005
Correct Answer:

Verified
Correct Answer:
Verified
Q14: Rational subgrouping allows us to detect changes
Q15: If <img src="https://d2lvgg3v3hfg70.cloudfront.net/TB1736/.jpg" alt="If =
Q16: Suppose that <img src="https://d2lvgg3v3hfg70.cloudfront.net/TB1736/.jpg" alt="Suppose that
Q18: If <img src="https://d2lvgg3v3hfg70.cloudfront.net/TB1736/.jpg" alt="If =
Q19: When employing measurement data to study a
Q22: A(n)_ chart monitors the number of nonconforming
Q24: The natural tolerance limits for a normally
Q32: A range chart is a control chart
Q51: How well a process is able to
Q75: Observing the output of a process at