Multiple Choice
Suppose that  and R charts based on subgroups of size 4 are being used to monitor the tire diameter of a new radial tire.The
  andR charts are found to be in statistical control with
 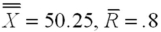 inches.A histogram of the tire diameter measurements indicates that these measurements are approximately normally distributed.If the tire diameter specifications are 50 inches ± 1 inch,is the process capable of meeting the specifications?
A) Yes
B) No
Correct Answer:

Verified
Correct Answer:
Verified
Q12: Which of the following control charts is
Q13: If <img src="https://d2lvgg3v3hfg70.cloudfront.net/TB1736/.jpg" alt="If =
Q14: A control chart on which the proportions
Q14: Rational subgrouping allows us to detect changes
Q15: If <img src="https://d2lvgg3v3hfg70.cloudfront.net/TB1736/.jpg" alt="If =
Q18: If <img src="https://d2lvgg3v3hfg70.cloudfront.net/TB1736/.jpg" alt="If =
Q19: When employing measurement data to study a
Q20: A foreman wants to use an <img
Q32: A range chart is a control chart
Q60: _ is the set of international standards