Multiple Choice
Using the following data,describe the shape of the data distribution. 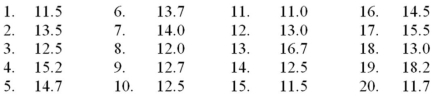
A) Skewed to the left
B) Bimodal
C) Normal
D) Skewed to the right
Correct Answer:

Verified
Correct Answer:
Verified
Related Questions
Q35: A stem-and-leaf display is a graphical portrayal
Q35: All of the following are used to
Q45: Using the following data,what would be the
Q67: Which one of the following graphical tools
Q75: Which of the following graphs is for
Q79: The number of weekly sales calls by
Q81: Recently an advertising company called 200 people
Q83: A histogram that tails out toward larger
Q94: The following is a relative frequency distribution
Q113: In the first step of setting up