Multiple Choice
Using the following data,what would be the range of the values of the stem in a stem-and-leaf display? 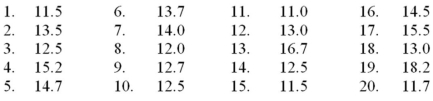
A) 11-17
B) 11-18
C) 10-18
D) 12-17
E) 12-18
Correct Answer:

Verified
Correct Answer:
Verified
Related Questions
Q21: _ and _ are used to describe
Q35: All of the following are used to
Q40: Using the following data,describe the shape of
Q43: A flaw possessed by a population or
Q47: Each stem of a stem-and-leaf display should
Q50: The following is a relative frequency distribution
Q70: A bar chart is a graphic that
Q75: Which of the following graphs is for
Q94: The following is a relative frequency distribution
Q113: In the first step of setting up