Essay
Suppose that the table shown below contains information technology (IT) investment as a percentage of total investment for eight countries during a recent decade. It also contains the average annual percentage change in employment during this decade. Explain how these data shed light on the question of whether IT investment creates or costs jobs. (Hint: Use the data to construct a scatterplot.) 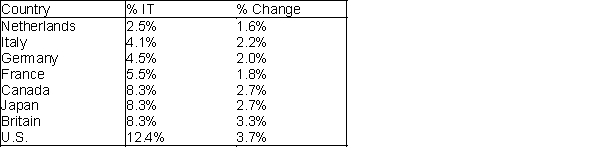
Correct Answer:

Verified
The scatterplot displayed below shows t...View Answer
Unlock this answer now
Get Access to more Verified Answers free of charge
Correct Answer:
Verified
View Answer
Unlock this answer now
Get Access to more Verified Answers free of charge
Q1: Approximate the percentage of these Internet users
Q9: Which two variables have the strongest linear
Q18: Correlation and covariance measure:<br>A) the strength of
Q22: The Filters field of a pivot table
Q23: A sample of 30 schools produced the
Q26: We can infer that there is a
Q29: The correlation between two variables is unitless
Q44: A trend line on a scatterplot is
Q158: If the sample is a good representation
Q168: If the sample is a good representation