Essay
A sample of 30 schools produced the pivot table shown below for the average percentage of students graduating from high school. Use this table to determine how the type of school (public or Catholic) that students attend affects their chance of graduating from high school. 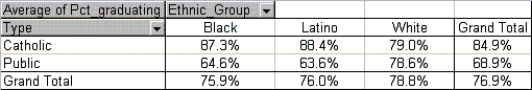
Correct Answer:

Verified
The percentages in the right column sugg...View Answer
Unlock this answer now
Get Access to more Verified Answers free of charge
Correct Answer:
Verified
View Answer
Unlock this answer now
Get Access to more Verified Answers free of charge
Q18: Correlation and covariance measure:<br>A) the strength of
Q21: Suppose that the table shown below contains
Q22: The Filters field of a pivot table
Q26: We can infer that there is a
Q27: The limitation of covariance as a descriptive
Q28: If the correlation of variables is close
Q29: The correlation between two variables is unitless
Q44: A trend line on a scatterplot is
Q158: If the sample is a good representation
Q168: If the sample is a good representation