Essay
The owner of a pizza restaurant chain would like to predict the sales of her recent specialty, a Mediterranean flatbread pizza. She has gathered data on monthly sales of the Mediterranean flatbread pizza at her restaurants. She has also gathered information related to the average price of flatbread pizzas, the monthly advertising expenditures, and the disposable income per household in the areas surrounding the restaurants. Below you will find output from the stepwise regression analysis. The p-value method was used with a cutoff of 0.05. 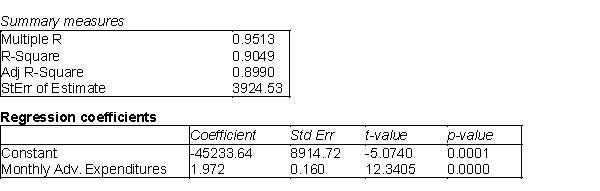
-(A) Summarize the findings of the stepwise regression method using this cutoff value.
(B) When the cutoff value was increased to 0.10, the output below was the result. The table at top left represents the change when the disposable income variable is added to the model and the table at top right represents the average price variable being added. The regression model with both added variables is shown in the bottom table. Summarize the results for this model. 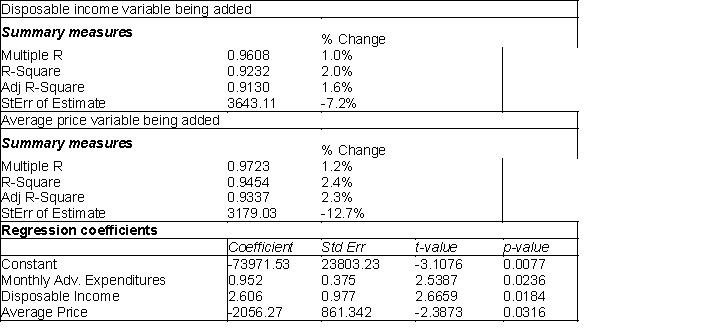 (C) Which model would you recommend using? Why?
Correct Answer:

Verified
(A) When a cutoff value of 0.05 is use...View Answer
Unlock this answer now
Get Access to more Verified Answers free of charge
Correct Answer:
Verified
(A) When a cutoff value of 0.05 is use...
View Answer
Unlock this answer now
Get Access to more Verified Answers free of charge
Q4: In the standardized value <img src="https://d2lvgg3v3hfg70.cloudfront.net/TB1387/.jpg" alt="In
Q5: An Internet-based retail company that specializes in
Q8: In a simple linear regression model, testing
Q9: Multicollinearity is a situation in which two
Q9: The owner of a large chain of
Q11: Many companies manufacture products that are at
Q12: What is not one of the guidelines
Q21: An error term represents the vertical distance
Q35: The value of the sum of squares
Q56: In a multiple regression analysis involving 4