Essay
Many companies manufacture products that are at least partially produced using chemicals (for example, paint). In many cases, the quality of the finished product is a function of the temperature and pressure at which the chemical reactions take place. Suppose that a particular manufacturer in Texas wants to model the quality (Y) of a product as a function of the temperature  and the pressure
  at which it is produced. The table below contains data obtained from a designed experiment involving these variables. Note that the assigned quality score can range from a minimum of 0 to a maximum of 100 for each manufactured product.
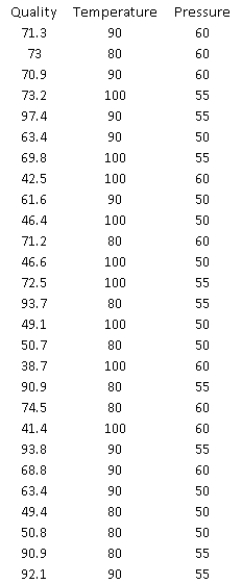
-(A) Estimate a multiple regression model that includes the two given explanatory variables. Assess this set of explanatory variables with an F-test, and report a p-value.
(B) Identify and interpret the percentage of variance explained for the model in (A).
(C) Identify and interpret the percentage of variance explained for the model in (B).
(D) Which regression equation is the most appropriate one for modeling the quality of the given product? Bear in mind that a good statistical model is usually parsimonious.
Correct Answer:

Verified
(A)

The p-value associated with...View Answer
Unlock this answer now
Get Access to more Verified Answers free of charge
Correct Answer:
Verified
(A)
The p-value associated with...
View Answer
Unlock this answer now
Get Access to more Verified Answers free of charge
Q7: The owner of a pizza restaurant chain
Q8: In a simple linear regression model, testing
Q9: The owner of a large chain of
Q12: What is not one of the guidelines
Q14: A local truck rental company wants to
Q15: In regression analysis, the ANOVA table analyzes:<br>A)
Q16: In multiple regressions, if the F-ratio is
Q21: An error term represents the vertical distance
Q26: Multiple regression represents an improvement over simple
Q35: The value of the sum of squares