Essay
Chocolate, Inc. manufactures 4 ounce chocolate bars. Random samples of size four were taken and weighed. Eight hours of observation provided the following data. 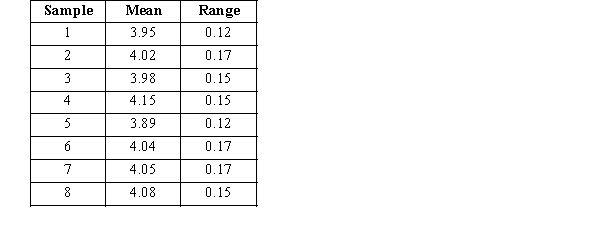
a.Determine the 3 sigma upper and lower control limits for the x-bar chart.
b.Determine the 3 sigma upper and lower control limits for the R-chart.
Correct Answer:

Verified
a.UCL = 4....View Answer
Unlock this answer now
Get Access to more Verified Answers free of charge
Correct Answer:
Verified
View Answer
Unlock this answer now
Get Access to more Verified Answers free of charge
Q19: Nancy, Inc. manufactures 4 ounce chocolate bars.
Q20: The upper and lower control limits of
Q21: A production process is considered in control
Q22: If the lower-control limit of a P
Q23: A production process is considered in control
Q24: The results of inspection of samples of
Q25: A production process that is in
Q26: The quality control department of a company
Q27: Variations in process output that are due
Q29: A production process is set up