Essay
The following time series gives the number of units sold during 5 years at a boat dealership. 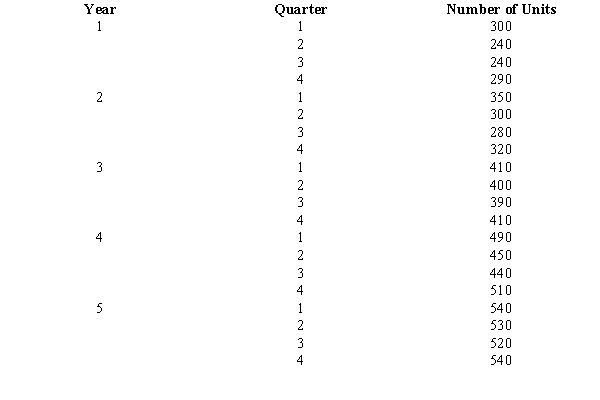
a. Find the four-quarter centered moving averages.
b. Plot the series and the moving averages on a graph.
c. Compute the seasonal-irregular component.
d. Compute the seasonal factors for all four quarters.
e. Compute the deseasonalized time series for sales.
f. Calculate the linear trend from the deseasonalized sales.
g. Forecast the number of units sold in each quarter of year 6.
Correct Answer:

Verified
a.273.75, 287.5, 300, 308.75, 320, 340, ...View Answer
Unlock this answer now
Get Access to more Verified Answers free of charge
Correct Answer:
Verified
View Answer
Unlock this answer now
Get Access to more Verified Answers free of charge
Q18: The time series component that reflects variability
Q19: The quarterly sales of a company (in
Q20: The sales records of a major auto
Q21: The following time series shows the
Q23: The temperature in Chicago has been recorded
Q24: The trend component is easy to identify
Q24: Below you are given the first four
Q25: The model that assumes that the actual
Q26: Actual sales for January through April are
Q27: Which of the following smoothing constants would