Essay
The quarterly sales of a company (in millions of dollars) over the past three years are given in the following table. 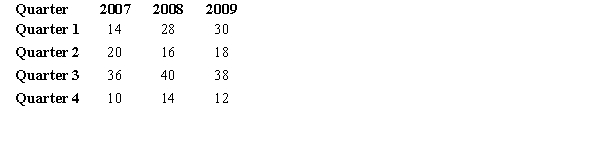
a.Compute the four seasonal factors (Seasonal Indexes). Show all of your computations.
b.The trend for these data is Trend = 20.82 + 0.336 t (t represents time, where t=1 for Quarter 1 of 2007 and t=12 for Quarter 4 of 2009). Forecast sales for the first quarter of 2010 using the trend only. Show all of your computations.
c.Forecast sales for the first quarter of 2010 using the trend and seasonal indexes and write your answer below. Show all of your computations.
Correct Answer:

Verified
 b.$25.188...
View Answer
Unlock this answer now
Get Access to more Verified Answers free of charge
Correct Answer:
Verified
View Answer
Unlock this answer now
Get Access to more Verified Answers free of charge
Q14: Exhibit 18-1<br>Below you are given the first
Q15: The following data show the quarterly sales
Q16: Exhibit 18-1<br>Below you are given the first
Q18: The time series component that reflects variability
Q20: The sales records of a major auto
Q21: The following time series shows the
Q22: The following time series gives the number
Q23: The temperature in Chicago has been recorded
Q24: The trend component is easy to identify
Q24: Below you are given the first four