Essay
The following data show the quarterly sales of a major auto manufacturer (introduced in exercise 4) for the years 8 through 10. 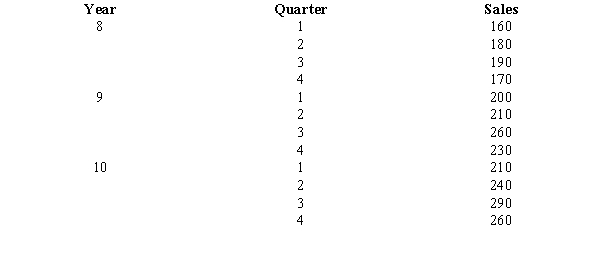
a.Compute the four-quarter moving average values for the above time series.
b.Compute the seasonal factors for the four quarters.
c.Use the seasonal factors developed in Part b to adjust the forecast for the effect of season for year 9.
Correct Answer:

Verified
a.180.00, 188.75, 201.25, 217....View Answer
Unlock this answer now
Get Access to more Verified Answers free of charge
Correct Answer:
Verified
View Answer
Unlock this answer now
Get Access to more Verified Answers free of charge
Q10: What is the forecast for July based
Q11: A component of the time series model
Q12: Student enrollment at a university over the
Q13: Given an actual demand of 61, forecast
Q14: Exhibit 18-1<br>Below you are given the first
Q16: Exhibit 18-1<br>Below you are given the first
Q18: The time series component that reflects variability
Q19: The quarterly sales of a company (in
Q20: The sales records of a major auto
Q24: The trend component is easy to identify