Multiple Choice
Exhibit 16-1
In a regression analysis involving 25 observations, the following estimated regression equation was developed. 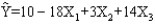 Also, the following standard errors and the sum of squares were obtained.
Sb1 = 3
Sb2 = 6
Sb3 = 7
SST = 4,800
SSE = 1,296
-Refer to Exhibit 16-1. The p-value for testing the significance of the regression model is
A) less than 0.01
B) between 0.01 and 0.025
C) between 0.025 and 0.05
D) between 0.05 and 0.1
Correct Answer:

Verified
Correct Answer:
Verified
Q65: A regression model relating the yearly income
Q66: Exhibit 16-2<br>In a regression model involving 30
Q67: Exhibit 16-4<br>In a laboratory experiment, data were
Q68: A regression analysis was applied in
Q69: Serial correlation is<br>A)the correlation between serial numbers
Q71: Exhibit 16-4<br>In a laboratory experiment, data were
Q72: Monthly total production costs and the number
Q73: The range of the Durbin-Watson statistic is
Q74: Thirty-four observations of a dependent variable (Y)
Q75: Exhibit 16-4<br>In a laboratory experiment, data were