Essay
Monthly total production costs and the number of units produced at a local company over a period of 10 months are shown below. 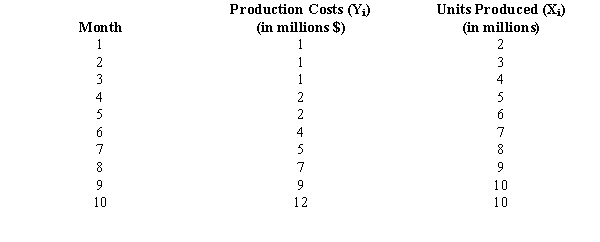
a.Draw a scatter diagram for the above data.
b.Assume that a model in the form of  best describes the relationship between X and Y. Estimate the parameters of this curvilinear regression equation.
Correct Answer:

Verified
a.  b.b0 = ...
View Answer
Unlock this answer now
Get Access to more Verified Answers free of charge
Correct Answer:
Verified
View Answer
Unlock this answer now
Get Access to more Verified Answers free of charge
Q66: Exhibit 16-2<br>In a regression model involving 30
Q67: Exhibit 16-4<br>In a laboratory experiment, data were
Q68: A regression analysis was applied in
Q69: Serial correlation is<br>A)the correlation between serial numbers
Q70: Exhibit 16-1<br>In a regression analysis involving 25
Q71: Exhibit 16-4<br>In a laboratory experiment, data were
Q73: The range of the Durbin-Watson statistic is
Q74: Thirty-four observations of a dependent variable (Y)
Q75: Exhibit 16-4<br>In a laboratory experiment, data were
Q76: Exhibit 16-2<br>In a regression model involving 30