Essay
The prices of Rawlston, Inc. stock (y) over a period of 12 days, the number of shares (in 100s) of company's stocks sold (x1), and the volume of exchange (in millions) on the New York Stock Exchange (x2) are shown below. 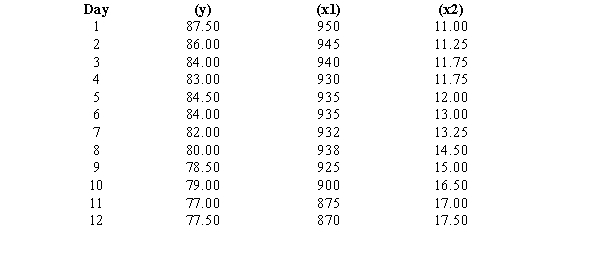 Excel was used to determine the least-squares regression equation. Part of the computer output is shown below.
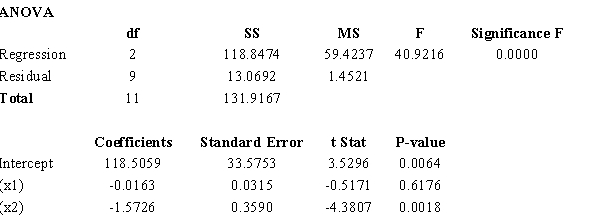
a. Use the output shown above and write an equation that can be used to predict the price of the stock.
b. Interpret the coefficients of the estimated regression equation that you found in Part a.
c. At 95% confidence, determine which variables are significant and which are not.
d. If in a given day, the number of shares of the company that were sold was 94,500 and the volume of exchange on the New York Stock Exchange was 16 million, what would you expect the price of the stock to be?
Correct Answer:

Verified
a.  = 118.5055 - 0.0163x1 - 1.5726x2
b.As ...View Answer
Unlock this answer now
Get Access to more Verified Answers free of charge
Correct Answer:
Verified
b.As ...
View Answer
Unlock this answer now
Get Access to more Verified Answers free of charge
Q11: Exhibit 15-8<br>The following estimated regression model was
Q12: Exhibit 15-8<br>The following estimated regression model was
Q13: Exhibit 15-2<br>A regression model between sales (Y
Q14: Exhibit 15-6<br>Below you are given a partial
Q17: Exhibit 15-3<br>In a regression model involving 30
Q18: A multiple regression model has the form
Q19: A variable that cannot be measured in
Q21: The following is part of the
Q50: The multiple coefficient of determination is<br>A) MSR/MST.<br>B)
Q95: In order to test for the significance