Multiple Choice
Exhibit 15-6
Below you are given a partial computer output based on a sample of 16 observations. 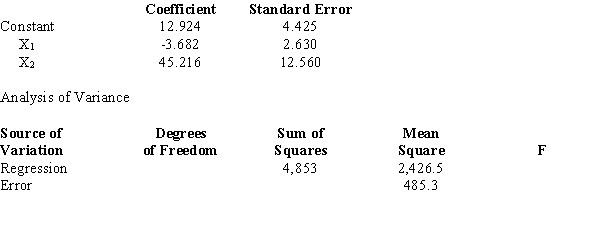
-Refer to Exhibit 15-6. The F value obtained from the table used to test if there is a relationship among the variables at the 5% level equals
A) 3.41
B) 3.63
C) 3.81
D) 19.41
Correct Answer:

Verified
Correct Answer:
Verified
Q9: A regression was performed on a
Q10: Exhibit 15-2<br>A regression model between sales (Y
Q11: Exhibit 15-8<br>The following estimated regression model was
Q12: Exhibit 15-8<br>The following estimated regression model was
Q13: Exhibit 15-2<br>A regression model between sales (Y
Q16: The prices of Rawlston, Inc. stock (y)
Q17: Exhibit 15-3<br>In a regression model involving 30
Q18: A multiple regression model has the form
Q19: A variable that cannot be measured in
Q95: In order to test for the significance