Essay
In order to determine whether or not the number of automobiles sold per day (Y) is related to price (X1 in $1,000), and the number of advertising spots (X2), data were gathered for 7 days. Part of the regression results is shown below. 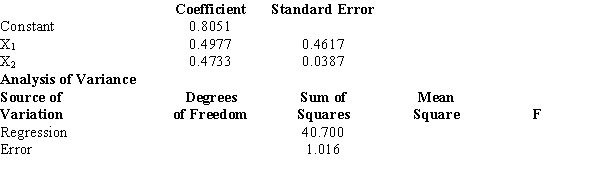
a. Determine the least squares regression function relating Y to X1 and X2.
b. If the company charges $20,000 for each car and uses 10 advertising spots, how many cars would you expect them to sell in a day?
c. At = 0.05, test to determine if the fitted equation developed in Part a represents a significant relationship between the independent variables and the dependent variable.d. At 95% confidence, test to see if price is a significant variable.e. At 95% confidence, test to see if the number of advertising spots is a significant variable.f. Determine the multiple coefficient of determination.
Correct Answer:

Verified
a.  b.16 (rounded from 15.49)
c.F = 80.1...View Answer
Unlock this answer now
Get Access to more Verified Answers free of charge
Correct Answer:
Verified
c.F = 80.1...
View Answer
Unlock this answer now
Get Access to more Verified Answers free of charge
Q1: The mathematical equation relating the expected value
Q2: Multiple regression analysis was used to
Q3: The following results were obtained from a
Q4: The Brock Juice Company has developed
Q5: Exhibit 15-5<br>Below you are given a
Q7: The correct relationship between SST, SSR, and
Q8: For a multiple regression model, SST =
Q9: A regression was performed on a
Q10: Exhibit 15-2<br>A regression model between sales (Y
Q11: Exhibit 15-8<br>The following estimated regression model was