Multiple Choice
Exhibit 15-2
A regression model between sales (Y in $1,000) , unit price (X1 in dollars) and television advertisement (X2 in dollars) resulted in the following function: 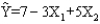 For this model SSR = 3500, SSE = 1500, and the sample size is 18.
-Refer to Exhibit 15-2. The coefficient of the unit price indicates that if the unit price is
A) increased by $1 (holding advertising constant) , sales are expected to increase by $3
B) decreased by $1 (holding advertising constant) , sales are expected to decrease by $3
C) increased by $1 (holding advertising constant) , sales are expected to increase by $4,000
D) increased by $1 (holding advertising constant) , sales are expected to decrease by $3,000
Correct Answer:

Verified
Correct Answer:
Verified
Q5: Exhibit 15-5<br>Below you are given a
Q6: In order to determine whether or
Q7: The correct relationship between SST, SSR, and
Q8: For a multiple regression model, SST =
Q9: A regression was performed on a
Q11: Exhibit 15-8<br>The following estimated regression model was
Q12: Exhibit 15-8<br>The following estimated regression model was
Q13: Exhibit 15-2<br>A regression model between sales (Y
Q14: Exhibit 15-6<br>Below you are given a partial
Q95: In order to test for the significance