Essay
The following table shows the results of a study on smoking and three illnesses. We are interested in determining if the proportions smokers in the three categories are different from each other.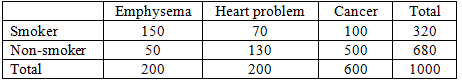
a.Provide the null and the alternative hypotheses.
b.Determine the expected frequencies.
c.Compute the sample proportions.
d.Compute the critical values (CVij).
e.Give your conclusions by providing numerical reasoning.
Correct Answer:

Verified
a. Ho: P1 = P1 = P1
Ha: N...View Answer
Unlock this answer now
Get Access to more Verified Answers free of charge
Correct Answer:
Verified
Ha: N...
View Answer
Unlock this answer now
Get Access to more Verified Answers free of charge
Q1: A medical journal reported the following frequencies
Q2: Exhibit 12-4<br>In the past, 35% of the
Q3: Exhibit 12-3<br>In order to determine whether or
Q4: The results of a recent study regarding
Q6: An important application of the chi-square distribution
Q7: Exhibit 12-8<br>The following shows the number of
Q8: Prior to the start of the season,
Q9: Exhibit 12-4<br>In the past, 35% of the
Q10: Exhibit 12-2<br>Last school year, the student body
Q11: A department store believes that telephone calls