Essay
Prior to the start of the season, it was expected that audience proportions for the four major news networks would be CBS 18.6%, NBC 12.5%, ABC 28.9% and BBC 40%. A recent sample of homes yielded the following viewing audience data. 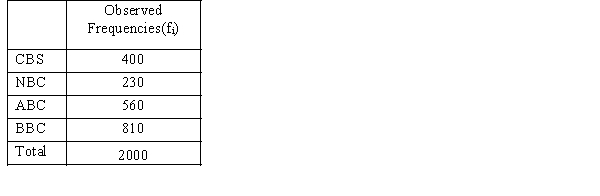 We want to determine whether or not the recent sample supports the expectations of the number of homes of the viewing audience of the four networks.
a.State the null and alternative hypotheses to be tested.
b.Compute the test statistic.
c.The null hypothesis is to be tested at 95% confidence. Determine the critical value for this test.
d.What do you conclude?
Correct Answer:

Verified
a.Ho: P1 =.186, P2 = .125, P3 = .289, P4 = .4
...View Answer
Unlock this answer now
Get Access to more Verified Answers free of charge
Correct Answer:
Verified
...
View Answer
Unlock this answer now
Get Access to more Verified Answers free of charge
Q3: Exhibit 12-3<br>In order to determine whether or
Q4: The results of a recent study regarding
Q5: The following table shows the results of
Q6: An important application of the chi-square distribution
Q7: Exhibit 12-8<br>The following shows the number of
Q9: Exhibit 12-4<br>In the past, 35% of the
Q10: Exhibit 12-2<br>Last school year, the student body
Q11: A department store believes that telephone calls
Q12: Exhibit 12-5<br>The table below gives beverage preferences
Q13: Exhibit 12-1<br>When individuals in a sample of