Multiple Choice
Exhibit 3-1
The following data show the number of hours worked by 200 statistics students. 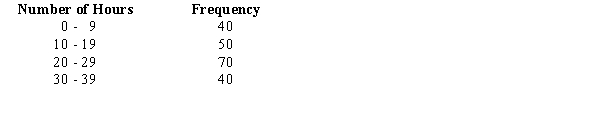
-Refer to Exhibit 3-1. The class width for this distribution
A) is 9
B) is 10
C) is 11
D) varies from class to class
Correct Answer:

Verified
Correct Answer:
Verified
Related Questions
Q59: A numerical measure of linear association between
Q79: Since the median is the middle value
Q80: The symbol <span class="ql-formula" data-value="\sigma"><span
Q81: In a five number summary, which of
Q82: A group of students had dinner at
Q83: Consider a sample with the following data
Q85: The value which has half of the
Q86: Growth factors for the population of Atlanta
Q88: The first quartile<br>A)contains at least one third
Q89: The following frequency distribution shows the time