Short Answer
The following frequency distribution shows the time (in minutes) that a sample of students uses the computer terminals per day. 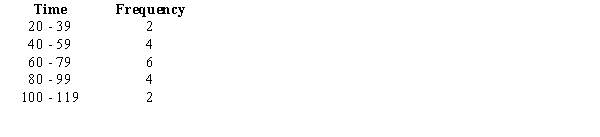
a.Compute the mean.
b.Compute the variance.
c.Compute the standard deviation.
d.Compute the coefficient of variation.
Correct Answer:

Verified
a.69.5
b.5...View Answer
Unlock this answer now
Get Access to more Verified Answers free of charge
Correct Answer:
Verified
b.5...
View Answer
Unlock this answer now
Get Access to more Verified Answers free of charge
Q53: The numerical value of the variance<br>A) is
Q59: A numerical measure of linear association between
Q84: Exhibit 3-1<br>The following data show the number
Q85: The value which has half of the
Q86: Growth factors for the population of Atlanta
Q88: The first quartile<br>A)contains at least one third
Q90: The mean of a sample<br>A)is always equal
Q92: Compute the weighted mean for the following
Q93: For the following frequency distribution (assume the
Q94: In 2008, the average age of students