Multiple Choice
Exhibit 3-1
The following data show the number of hours worked by 200 statistics students. 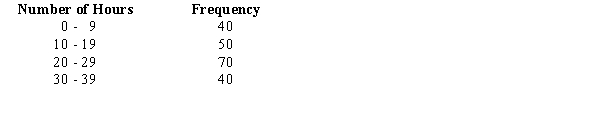
-Refer to Exhibit 3-1. The number of students working 19 hours or less
A) is 40
B) is 50
C) is 90
D) cannot be determined without the original data
Correct Answer:

Verified
Correct Answer:
Verified
Q120: Exhibit 3-4<br>The following is the frequency distribution
Q121: A sample of charge accounts at a
Q122: For the following frequency distribution, <img src="https://d2lvgg3v3hfg70.cloudfront.net/TB2206/.jpg"
Q123: In a statistics class, the average grade
Q124: The following data show the yearly salaries
Q126: The weights (in pounds) of a sample
Q127: The geometric mean of 1, 3, 5,
Q128: Which of the following symbols represents
Q129: The following data show the yearly salaries
Q130: The variance of the sample<br>A)can never be