Essay
The following data show the yearly salaries of a sample of MBA graduates. 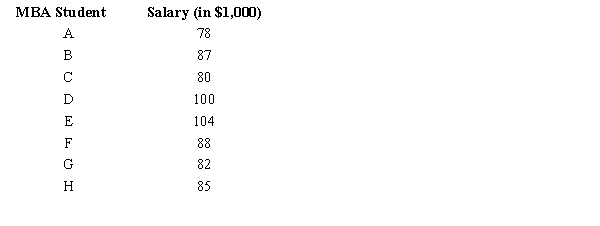
a.Compute the mean yearly salary and give your answer in dollars.
b.Compute the standard deviation and give your answer in dollars.
c.Compute the 75th percentile and give your answer in dollars. Fully explain what the value that you have determined indicates.
Correct Answer:

Verified
a.$88,000
b.$9,355.03
c.$94,00...View Answer
Unlock this answer now
Get Access to more Verified Answers free of charge
Correct Answer:
Verified
b.$9,355.03
c.$94,00...
View Answer
Unlock this answer now
Get Access to more Verified Answers free of charge
Q119: If the variance of a data set
Q120: Exhibit 3-4<br>The following is the frequency distribution
Q121: A sample of charge accounts at a
Q122: For the following frequency distribution, <img src="https://d2lvgg3v3hfg70.cloudfront.net/TB2206/.jpg"
Q123: In a statistics class, the average grade
Q125: Exhibit 3-1<br>The following data show the number
Q126: The weights (in pounds) of a sample
Q127: The geometric mean of 1, 3, 5,
Q128: Which of the following symbols represents
Q129: The following data show the yearly salaries