Multiple Choice
Exhibit 3-1
The following data show the number of hours worked by 200 statistics students. 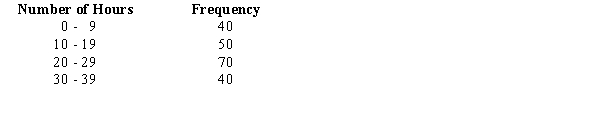
-Refer to Exhibit 3-1. The relative frequency of students working 9 hours or less
A) is .2
B) is .45
C) is 40
D) cannot be determined from the information given
Correct Answer:

Verified
Correct Answer:
Verified
Related Questions
Q5: In 2012, the average donation to the
Q15: The numerical value of the standard deviation
Q20: The following data represent the daily demand
Q21: Jason, a freshman at a local college,
Q22: The flashlight batteries produced by one of
Q23: Which of the following symbols represents
Q28: The last semester grades of Nancy, a
Q29: Which of the following is not a
Q57: In the fall semester of 2009, the
Q77: The sample variance<br>A) is always smaller than