Essay
The following data represent the daily demand (y in thousands of units) and the unit price (x in dollars) for a product. 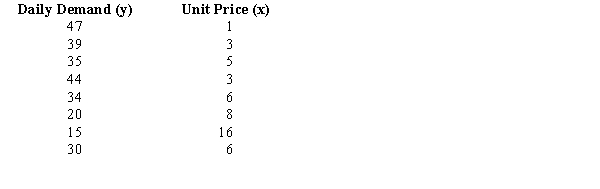
a.Compute and interpret the sample covariance for the above data.
b.Compute and interpret the sample correlation coefficient.
Correct Answer:

Verified
a.-47. Since the covariance is...View Answer
Unlock this answer now
Get Access to more Verified Answers free of charge
Correct Answer:
Verified
View Answer
Unlock this answer now
Get Access to more Verified Answers free of charge
Q16: If index i (which is used to
Q17: Global Engineers hired the following number of
Q18: Exhibit 3-2<br>A researcher has collected the following
Q21: Jason, a freshman at a local college,
Q22: The flashlight batteries produced by one of
Q23: Which of the following symbols represents
Q25: Exhibit 3-1<br>The following data show the number
Q42: When computing the mean, the smallest value<br>A)
Q44: The measure of location which is the
Q77: The sample variance<br>A) is always smaller than