Short Answer
The following frequency distribution shows the ACT scores of a sample of students: 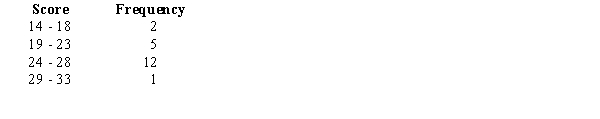 For the above data, compute the following.
a.The mean
b.The standard deviation
Correct Answer:

Verified
Correct Answer:
Verified
Related Questions
Q85: The median is a measure of<br>A) relative
Q93: During a cold winter, the temperature stayed
Q149: The table below shows the population growth
Q150: The following frequency distribution shows the yearly
Q151: In computing the mean of a
Q152: Below is a sample of scores from
Q156: Exhibit 3-6<br>The closing stock price of MNM
Q157: Compute the weighted mean for the following
Q158: If two groups of numbers have the
Q159: Since the population is always larger than