Short Answer
The table below shows the population growth rate of a city for the years 2008 through 2012. 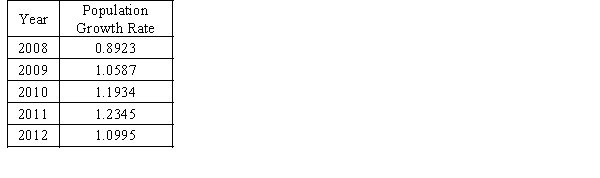
a.Compute the geometric mean.
b.What has been the percentage growth in the population of the city between 2009 to 2012?
Correct Answer:

Verified
a..
Geomet...View Answer
Unlock this answer now
Get Access to more Verified Answers free of charge
Correct Answer:
Verified
Geomet...
View Answer
Unlock this answer now
Get Access to more Verified Answers free of charge
Q20: The average wage of Tennessee cashiers is
Q56: The difference between the largest and the
Q84: If the coefficient of variation is 40%
Q85: The median is a measure of<br>A) relative
Q144: A numerical value used as a summary
Q145: The symbol <span class="ql-formula" data-value="\sigma"><span
Q150: The following frequency distribution shows the yearly
Q151: In computing the mean of a
Q152: Below is a sample of scores from
Q154: The following frequency distribution shows the ACT