Short Answer
The frequency distribution below shows the monthly expenditure on gasoline for a sample of 14 individuals. 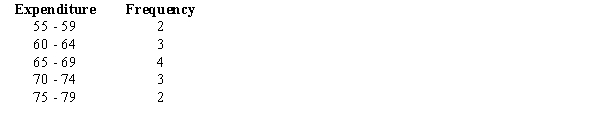
a.Compute the mean.
b.Compute the standard deviation.
Correct Answer:

Verified
Correct Answer:
Verified
Related Questions
Q111: When the smallest and largest percentage of
Q112: Which of the following symbols represents
Q113: The price of a selected stock over
Q114: The following frequency distribution shows the GMAT
Q115: A numerical measure of linear association between
Q117: The growth rate in thepopulation of Atlanta
Q118: The descriptive measure of dispersion that is
Q119: If the variance of a data set
Q120: Exhibit 3-4<br>The following is the frequency distribution
Q121: A sample of charge accounts at a