Short Answer
The following frequency distribution shows the GMAT scores of a sample of MBA students. 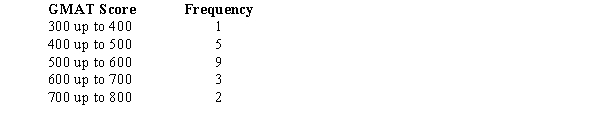 For the above data, compute the mean GMAT score.
Correct Answer:

Verified
Correct Answer:
Verified
Related Questions
Q109: Exhibit 3-4<br>The following is the frequency distribution
Q110: The number of hours worked per week
Q111: When the smallest and largest percentage of
Q112: Which of the following symbols represents
Q113: The price of a selected stock over
Q115: A numerical measure of linear association between
Q116: The frequency distribution below shows the monthly
Q117: The growth rate in thepopulation of Atlanta
Q118: The descriptive measure of dispersion that is
Q119: If the variance of a data set