Essay
The following data represent the daily supply (y in thousands of units) and the unit price (x in dollars) for a product. 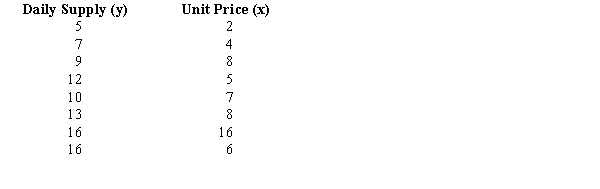
a.Compute and interpret the sample covariance for the above data.
b.Compute the standard deviation for the daily supply.
c.Compute the standard deviation for the unit price.
d.Compute and interpret the sample correlation coefficient.
Correct Answer:

Verified
a.11.43 (rounded). The covaria...View Answer
Unlock this answer now
Get Access to more Verified Answers free of charge
Correct Answer:
Verified
View Answer
Unlock this answer now
Get Access to more Verified Answers free of charge
Q32: Descriptive statistics for the closing stock prices
Q33: The interquartile range is used as a
Q34: The measure of dispersion that is influenced
Q35: The variance of a sample was reported
Q36: When computing the mean of a
Q38: Aubree, a college freshman, took 15 hours
Q40: The following frequency distribution shows the GMAT
Q41: Exhibit 3-6<br>The closing stock price of MNM
Q42: When should measures of location and dispersion
Q114: The heights (in inches) of 25 individuals