Short Answer
The following frequency distribution shows the GMAT scores of a sample of MBA students: 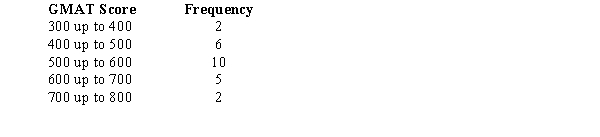 For the above data, compute the mean GMAT score.
Correct Answer:

Verified
Correct Answer:
Verified
Related Questions
Q35: The variance of a sample was reported
Q36: When computing the mean of a
Q37: The following data represent the daily supply
Q38: Aubree, a college freshman, took 15 hours
Q41: Exhibit 3-6<br>The closing stock price of MNM
Q42: When should measures of location and dispersion
Q43: The variance can never be<br>A)zero<br>B)larger than the
Q44: From a population of size 400, a
Q45: The following is a frequency distribution for
Q114: The heights (in inches) of 25 individuals