Short Answer
The following frequency distribution shows the starting salaries (in $1,000s) of a sample of business students: 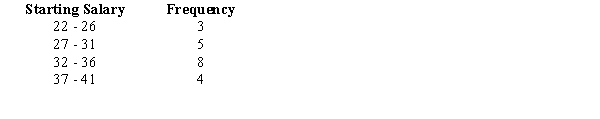 For the above data, compute the mean starting salary: (Give your answer in dollars.)
Correct Answer:

Verified
Correct Answer:
Verified
Related Questions
Q67: If a data set has an even
Q102: The hourly wages of a sample of
Q103: The amount of time that a sample
Q105: The standard deviation of a sample was
Q106: Last semester grades of Michael, a freshman
Q108: Exhibit 3-3<br>A researcher has collected the following
Q109: Exhibit 3-4<br>The following is the frequency distribution
Q110: The number of hours worked per week
Q111: When the smallest and largest percentage of
Q112: Which of the following symbols represents