Multiple Choice
Exhibit 3-4
The following is the frequency distribution for the speeds of a sample of automobiles traveling on an interstate highway. 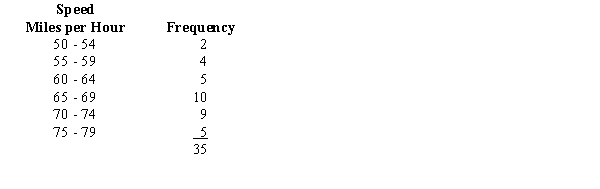
-Refer to Exhibit 3-4. The standard deviation is
A) 6.969
B) 7.071
C) 48.570
D) 50.000
Correct Answer:

Verified
Correct Answer:
Verified
Related Questions
Q67: If a data set has an even
Q105: The standard deviation of a sample was
Q106: Last semester grades of Michael, a freshman
Q107: The following frequency distribution shows the starting
Q108: Exhibit 3-3<br>A researcher has collected the following
Q110: The number of hours worked per week
Q111: When the smallest and largest percentage of
Q112: Which of the following symbols represents
Q113: The price of a selected stock over
Q114: The following frequency distribution shows the GMAT