Essay
The following data shows the price of PAO, Inc. stock over the last 8 months. 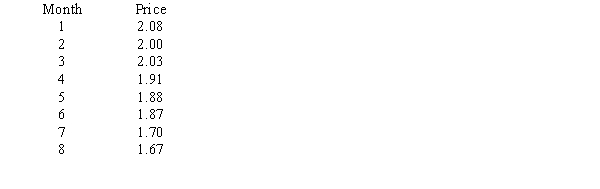
a.Develop a scatter diagram and draw a trend line through the points.
b.What kind of relationship exists between stock price and time (negative, positive, or no relation)?
Correct Answer:

Verified
Correct Answer:
Verified
Related Questions
Q18: A histogram is<br>A) a graphical presentation of
Q49: If several frequency distributions are constructed from
Q51: The sum of the relative frequencies for
Q52: For the following observations, plot a scatter
Q53: The percent frequency of a class is
Q55: A researcher is gathering data from four
Q56: Data that provide labels or names for
Q57: Thirty students in the School of Business
Q58: Exhibit 2-3<br>A survey of 800 college seniors
Q59: A student has completed 20 courses in