Essay
For the following observations, plot a scatter diagram and indicate what kind of relationship (if any) exist between x and y. 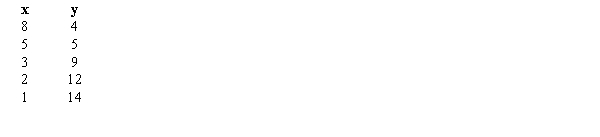
Correct Answer:

Verified
A negative relations...View Answer
Unlock this answer now
Get Access to more Verified Answers free of charge
Correct Answer:
Verified
A negative relations...
View Answer
Unlock this answer now
Get Access to more Verified Answers free of charge
Related Questions
Q18: A histogram is<br>A) a graphical presentation of
Q19: The sum of frequencies for all classes
Q48: When a histogram has a longer tail
Q49: If several frequency distributions are constructed from
Q51: The sum of the relative frequencies for
Q53: The percent frequency of a class is
Q54: The following data shows the price of
Q55: A researcher is gathering data from four
Q56: Data that provide labels or names for
Q57: Thirty students in the School of Business