Multiple Choice
Use the REGRESSION feature on a graphing calculator.
-The paired data below consists of the temperature on randomly chosen days and the amount of a certain kind of plant grew (in millimeters) . 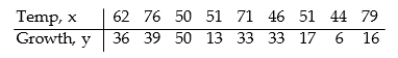 Find the linear function that predicts a plant's growth as a function of the temperature.Round your answer to two decimal places.
A) 
B) 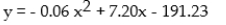
C) 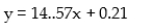
D) 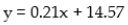
Correct Answer:

Verified
Correct Answer:
Verified
Q38: Solve the problem.<br>-Assume that the price per
Q39: Solve the formula for the specified variable.<br><br>-7x
Q40: Solve the formula for the specified variable.<br><br>-S
Q41: Use the REGRESSION feature on a graphing
Q42: Solve the inequality and graph. Express your
Q44: Use the REGRESSION feature on a graphing
Q45: Solve the inequality and graph. Express your
Q46: Provide an appropriate response.<br>-Use the graph to
Q48: Solve the problem.<br>-Find the Celsius temperature (to
Q53: Find the slope and y intercept of