Multiple Choice
Use the REGRESSION feature on a graphing calculator.
-In the table below,x represents the number of years since 2000 and y represents sales (in thousands of dollars) of a clothing company.Use the regression equation to estimate sales in the year 2006.Round to the nearest thousand dollars. 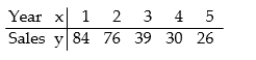
A) $14,000
B) $20,000
C) $2,000
D) $8,000
Correct Answer:

Verified
Correct Answer:
Verified
Q36: Use the graph to find the average
Q37: Provide an appropriate response.<br>-Use the graph to
Q38: Solve the problem.<br>-Assume that the price per
Q39: Solve the formula for the specified variable.<br><br>-7x
Q40: Solve the formula for the specified variable.<br><br>-S
Q42: Solve the inequality and graph. Express your
Q43: Use the REGRESSION feature on a graphing
Q44: Use the REGRESSION feature on a graphing
Q45: Solve the inequality and graph. Express your
Q46: Provide an appropriate response.<br>-Use the graph to