Multiple Choice
The following image is a 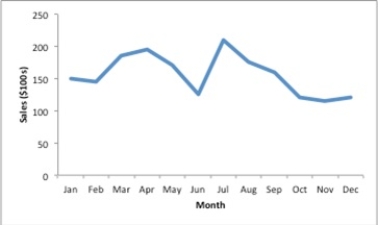
A) sparkline.
B) trendline.
C) gridline.
D) line chart.
Correct Answer:

Verified
Correct Answer:
Verified
Related Questions
Q15: We create multiple dashboards<br>A)to help the user
Q16: Natalie needs to compare the number of
Q17: Never use a _ chart when a
Q18: In a business, the values indicating the
Q19: Susan would like to create a graph
Q21: The charts that are helpful in making
Q22: A time series plot is also known
Q23: To generate a scatter chart matrix, we
Q24: This bar chart displays the demographics of
Q25: The data dashboard for a marketing manager