Multiple Choice
This bar chart displays the demographics of a Business Analysis class. How many male students are in the class? 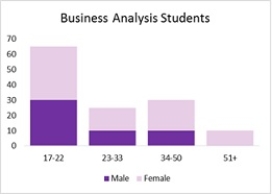
A) 30
B) 50
C) 80
D) 130
Correct Answer:

Verified
Correct Answer:
Verified
Related Questions
Q19: Susan would like to create a graph
Q20: The following image is a <img
Q21: The charts that are helpful in making
Q22: A time series plot is also known
Q23: To generate a scatter chart matrix, we
Q25: The data dashboard for a marketing manager
Q26: Which of the following graphs cannot be
Q27: To summarize and analyze data with both
Q28: A _ is a graphical presentation of
Q29: Construct a scatter chart for the