Multiple Choice
A time series plot of a period of time (in weeks) versus sales (in 1,000's of gallons) is shown below. Which of the following data patterns best describes the scenario shown? 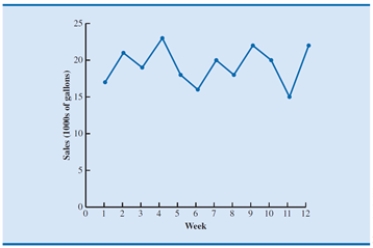
A) Time series with a linear trend pattern
B) Time series with a nonlinear trend pattern
C) Time series with no pattern
D) Time series with a horizontal pattern
Correct Answer:

Verified
Correct Answer:
Verified
Q25: A time series plot of a period
Q26: A time series that shows a recurring
Q27: In the moving averages method, the order
Q28: A positive forecast error indicates that the
Q29: The moving averages method refers to a
Q31: The mean absolute error, mean squared error,
Q32: Causal models<br>A)provide evidence of a causal relationship
Q33: Which of the following measures of forecast
Q34: Which of the following states the objective
Q35: Using a large value for order k