Multiple Choice
A time series plot of a period of time (quarterly) versus quarterly sales (in $1,000s) is shown below. Which of the following data patterns best describes the scenario shown? 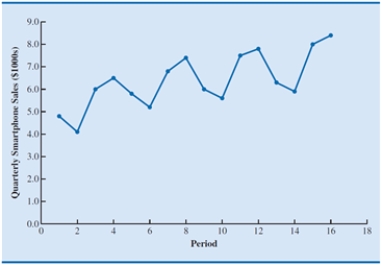
A) Linear trend and cyclical pattern
B) Linear trend and horizontal pattern
C) Seasonal and cyclical patterns
D) Seasonal pattern and linear trend
Correct Answer:

Verified
Correct Answer:
Verified
Q20: If a time series plot exhibits a
Q21: Which of the following statements is the
Q22: Which of the following is not true
Q23: The process of _ might be used
Q24: An exponential trend pattern occurs when<br>A)the amount
Q26: A time series that shows a recurring
Q27: In the moving averages method, the order
Q28: A positive forecast error indicates that the
Q29: The moving averages method refers to a
Q30: A time series plot of a period