Multiple Choice
A time series plot of a period of time (in years) versus revenue (in millions of dollars) is shown below. Which of the following data patterns best describes the scenario shown? 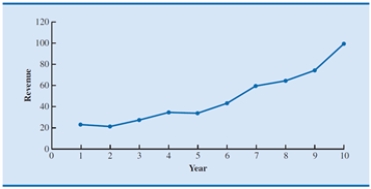
A) Linear trend pattern
B) Nonlinear trend pattern
C) Seasonal pattern
D) Cyclical pattern
Correct Answer:

Verified
Correct Answer:
Verified
Related Questions
Q2: A time series plot of a period
Q3: A set of observations on a variable
Q4: For causal modeling, _ are used to
Q5: Demand for a product and the
Q6: Trend refers to<br>A)the long-run shift or movement
Q7: A forecast is defined as a(n)<br>A)prediction of
Q8: Which of the following is not present
Q9: _ is the amount by which the
Q10: Autoregressive models<br>A)use the average of the most
Q11: With reference to time series data patterns,