Multiple Choice
Using the graph given below, which of the following equations represents the function shown in the graph? 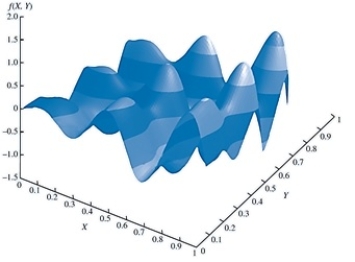
A) f(X, Y) = Xlog(2πY) + Ylog(2πX)
B) f(X, Y) = X - Y
C) f(X, Y) = -X2 - Y2
D) f(X, Y) = Xsin(5πX) + Ysin(5πY)
Correct Answer:

Verified
Correct Answer:
Verified
Related Questions
Q13: If there are no other feasible solutions
Q14: Using the graph below, which of the
Q15: A function that is bowl-shaped up is
Q16: Is a location optimization problem an example
Q17: A _ is the shadow price of
Q19: In the Bass forecasting model, the _
Q20: If an optimization objective function produces a
Q21: Using the graph below, the feasible region
Q22: A function that is bowl-shaped down is
Q23: One of the ways to formulate the