Multiple Choice
Using the graph below, the feasible region for the function represented in the graph is 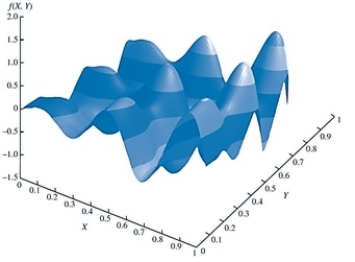
A) -1 £ X £ 1, -1 £ Y £ 1.
B) -1.5 £ X £ 1, 0 £ Y £ 8.
C) -1.5 £ X £ 2.0, -1.5 £ Y £ 2.0.
D) 0 £ X £ 1, 0 £ Y £ 1.
Correct Answer:

Verified
Correct Answer:
Verified
Related Questions
Q16: Is a location optimization problem an example
Q17: A _ is the shadow price of
Q18: Using the graph given below, which of
Q19: In the Bass forecasting model, the _
Q20: If an optimization objective function produces a
Q22: A function that is bowl-shaped down is
Q23: One of the ways to formulate the
Q24: A(n) _ is a set of points
Q25: Which of the following functions yields the
Q26: A portfolio optimization model used to construct