True/False
NARRBEGIN: Home Care
Home Care
Data are collected on the number of house calls (x) made in a given week by each of 60 nurses in a certain hospital. The same data set is displayed in each of the three histograms below. 

 NARREND
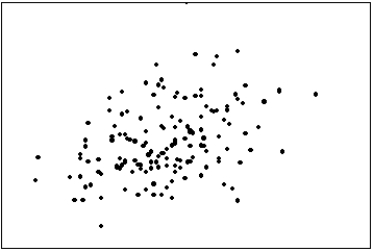
-The first scatter diagram below shows a stronger linear relationship than the second scatter diagram. (Assume the scales on both scatter diagrams are the same.) 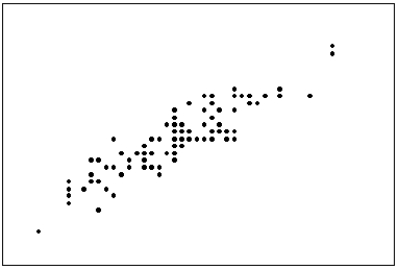
Correct Answer:

Verified
Correct Answer:
Verified
Q1: Correlation implies causation.
Q11: The number of class intervals in a
Q14: Electronics Company At a meeting of
Q35: Explain the difference between a histogram and
Q42: NARRBEGIN: Home Care<br>Home Care<br>Data are collected
Q51: NARRBEGIN: Home Care<br>Home Care<br>Data are collected on
Q94: What are the two most important characteristics
Q98: The sum of cumulative relative frequencies always
Q105: Experience shows that few students hand in
Q134: A(n)_ is a table that sorts data