Solved

NARRBEGIN: Home Care
Home Care
Data Are Collected on the Number

Question 42

Essay

NARRBEGIN: Home Care
Home Care
Data are collected on the number of house calls (x) made in a given week by each of 60 nurses in a certain hospital. The same data set is displayed in each of the three histograms below.  NARRBEGIN: Home Care Home Care Data are collected on the number of house calls (x) made in a given week by each of 60 nurses in a certain hospital. The same data set is displayed in each of the three histograms below.       NARREND -A department store's monthly sales (in thousands of dollars) for the last year were as follows. A histogram should be used to present these data.  \begin{array}{|l|cccccccccccc|} \hline\text { Month } & 1 & 2 & 3 & 4 & 5 & 6 & 7 & 8 & 9 & 10 & 11 & 12 \\ \hline \text { Sales } & 78 & 74 & 83 & 87 & 85 & 93 & 100 & 105 & 103 & 89 & 78 & 94\\\hline \end{array}  NARRBEGIN: Home Care Home Care Data are collected on the number of house calls (x) made in a given week by each of 60 nurses in a certain hospital. The same data set is displayed in each of the three histograms below.       NARREND -A department store's monthly sales (in thousands of dollars) for the last year were as follows. A histogram should be used to present these data.  \begin{array}{|l|cccccccccccc|} \hline\text { Month } & 1 & 2 & 3 & 4 & 5 & 6 & 7 & 8 & 9 & 10 & 11 & 12 \\ \hline \text { Sales } & 78 & 74 & 83 & 87 & 85 & 93 & 100 & 105 & 103 & 89 & 78 & 94\\\hline \end{array}  NARRBEGIN: Home Care Home Care Data are collected on the number of house calls (x) made in a given week by each of 60 nurses in a certain hospital. The same data set is displayed in each of the three histograms below.       NARREND -A department store's monthly sales (in thousands of dollars) for the last year were as follows. A histogram should be used to present these data.  \begin{array}{|l|cccccccccccc|} \hline\text { Month } & 1 & 2 & 3 & 4 & 5 & 6 & 7 & 8 & 9 & 10 & 11 & 12 \\ \hline \text { Sales } & 78 & 74 & 83 & 87 & 85 & 93 & 100 & 105 & 103 & 89 & 78 & 94\\\hline \end{array} NARREND
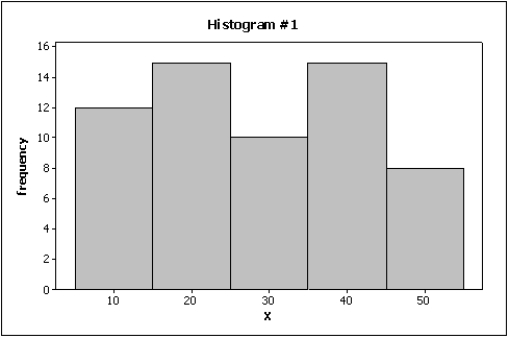
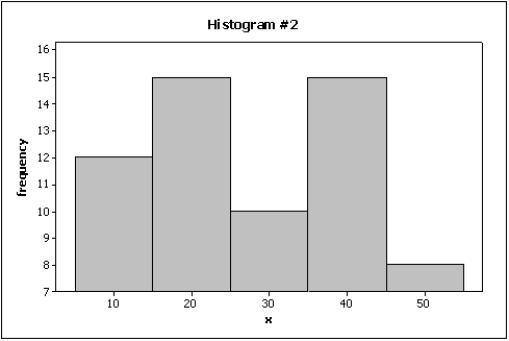
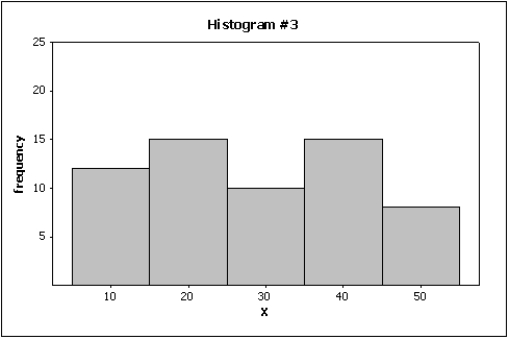
-A department store's monthly sales (in thousands of dollars) for the last year were as follows. A histogram should be used to present these data.  Month 123456789101112 Sales 787483878593100105103897894\begin{array}{|l|cccccccccccc|}\hline\text { Month } & 1 & 2 & 3 & 4 & 5 & 6 & 7 & 8 & 9 & 10 & 11 & 12 \\\hline \text { Sales } & 78 & 74 & 83 & 87 & 85 & 93 & 100 & 105 & 103 & 89 & 78 & 94\\\hline\end{array}

Correct Answer:

verifed

Verified

Unlock this answer now
Get Access to more Verified Answers free of charge

Related Questions