Essay
NARRBEGIN: Home Care
Home Care
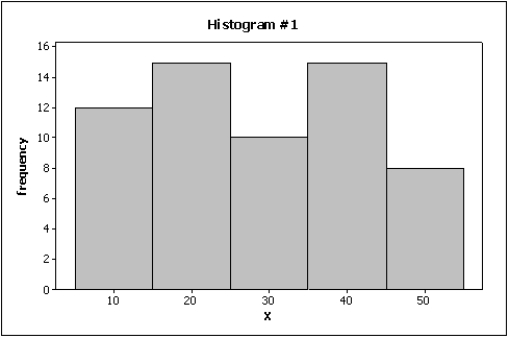
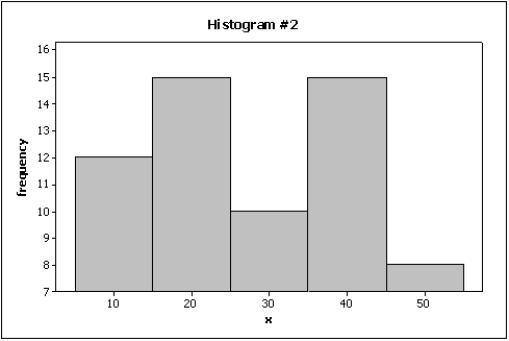
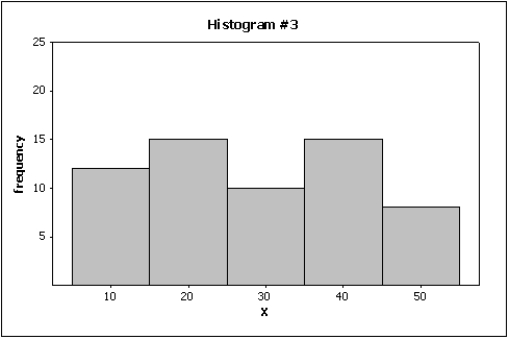
Data are collected on the number of house calls (x) made in a given week by each of 60 nurses in a certain hospital. The same data set is displayed in each of the three histograms below. 

 NARREND
-The number of houses sold in Miami Springs and the average monthly mortgage rates for 18 months randomly selected between January 2011 and April 2013 are shown in the following table.
a.Draw a scatter diagram with the number of houses sold on the vertical axis.
b.Describe the relationship between mortgage rate and number of houses sold.
Correct Answer:

Verified
a.b.There is a strong negative...View Answer
Unlock this answer now
Get Access to more Verified Answers free of charge
Correct Answer:
Verified
View Answer
Unlock this answer now
Get Access to more Verified Answers free of charge
Q25: {Teachers Ages Narrative} Draw a frequency histogram
Q30: If two variables have a strong linear
Q45: Which of the following describes an ogive?<br>A)
Q84: How do you determine whether two interval
Q99: NARRBEGIN: Home Care<br>Home Care<br>Data are collected on
Q104: The relative frequency of a class in
Q109: The graphical technique used to describe the
Q125: In a histogram,each observation is assigned to
Q142: Which of the following statements about histograms
Q145: Can a scatter diagram be used to