Multiple Choice
NARRBEGIN: Home Care
Home Care
Data are collected on the number of house calls (x) made in a given week by each of 60 nurses in a certain hospital. The same data set is displayed in each of the three histograms below. 

 NARREND
-What type of graph depicts the data below? 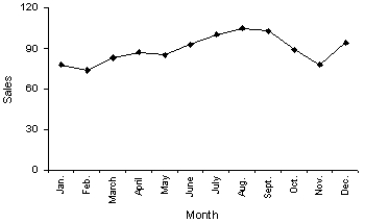
A) A line chart
B) A histogram
C) A dot plot
D) A bar chart
Correct Answer:

Verified
Correct Answer:
Verified
Q25: {Teachers Ages Narrative} Draw a frequency histogram
Q30: If two variables have a strong linear
Q84: How do you determine whether two interval
Q100: NARRBEGIN: Home Care<br>Home Care<br>Data are collected
Q104: The relative frequency of a class in
Q109: The graphical technique used to describe the
Q125: In a histogram,each observation is assigned to
Q142: Which of the following statements about histograms
Q145: Can a scatter diagram be used to
Q145: A(n)_ is a graphical representation of the